Local-first trajectory evidence for VS Code

Understand what your coding agent actually did.

Find any Claude Code or Codex session, read every layer of the conversation, inspect the exact Claude request, and see context, tools, phases, failures, and compaction as one trajectory.

Claude Code Codex Sessions stay local
Trajectory VisualizerVisual Studio Code
Claude Code

Make checkout retries observable and safe

6 turns · 18 API calls · 12 tools
146.9K peak context1 compaction15 tests passed
Context trajectory200K limit
Turn 4

Investigate the duplicate charge report…

3 calls
Turn 5

Continue from the compaction summary…

3 calls
Turn 6

Do one final review and typecheck…

2 calls
Find the exact session by date, time, title, or path.Live refresh
Searchable TimelineExact API CaptureLinked Process ViewsPersonal Agent AnalyticsHarness & Memory

55-second product tour

From “where was that session?” to the exact request.

Trajectory Visualizer · Extension tour
00:00

Find sessions by exact time, title, or project path.

Five main features

Start from the question you need answered.

01

Recover & Read

Stop losing useful answers to terminal scrollback.

Find a session by time or path, then open only the Turn you need. Prompt and Final Response come first; the full process stays one click deeper.

  • Search prompts, responses, tools, paths, and cues
  • Read long text full screen and copy it cleanly
  • Resume or export without hunting for a session id
Trajectory Visualizer · Timeline
READY

Turns stay compact until you need one.

02

Inspect the Exact Request

See what Claude received—not only what you typed.

Jump from an inline Timeline call to the complete API Capture: prompt assembly, system blocks, message history, tool schemas, response events, timing, and raw JSON.

  • Session-global and Turn-local call numbers stay linked
  • Long sections page by complete message or content block
  • Every raw block can open in the full-screen reader
Trajectory Visualizer · API Capture Off → On
READY

Click Capture: Off in VS Code's status bar; new terminals are captured automatically.

Trajectory Visualizer · Timeline → API Capture
READY

Open the captured call from its exact Timeline step.

03

Understand the Run

One playhead. Every process lens.

Move or shrink the Overview window and Context, Prompt Workload, Tool Use, transitions, compaction, and Phase Map all follow the same selected part of the run.

  • Compare steps driven with context added correctly
  • Read the retained Summary After Compaction
  • Jump any prompt, tool group, phase, or failure back to Timeline
Trajectory Visualizer · Views
READY

Shrink the Overview window and every panel follows.

04

See Your Agent Habits

Your personal coding-agent wrapped.

Runtime Rank, Achievements, Calendar, prompt hours, frequent words, latency, and Claude Code vs Codex turn local session history into a useful—and fun—usage recap.

  • Open every session from a selected calendar day
  • Copy Resume Args with one click
  • All metrics are computed locally with no extra API cost
Trajectory Visualizer · Dashboard
READY

Runtime Rank grows with recorded agent work time.

05

Agent Harness & Memory

See the context around the agent, not just its messages.

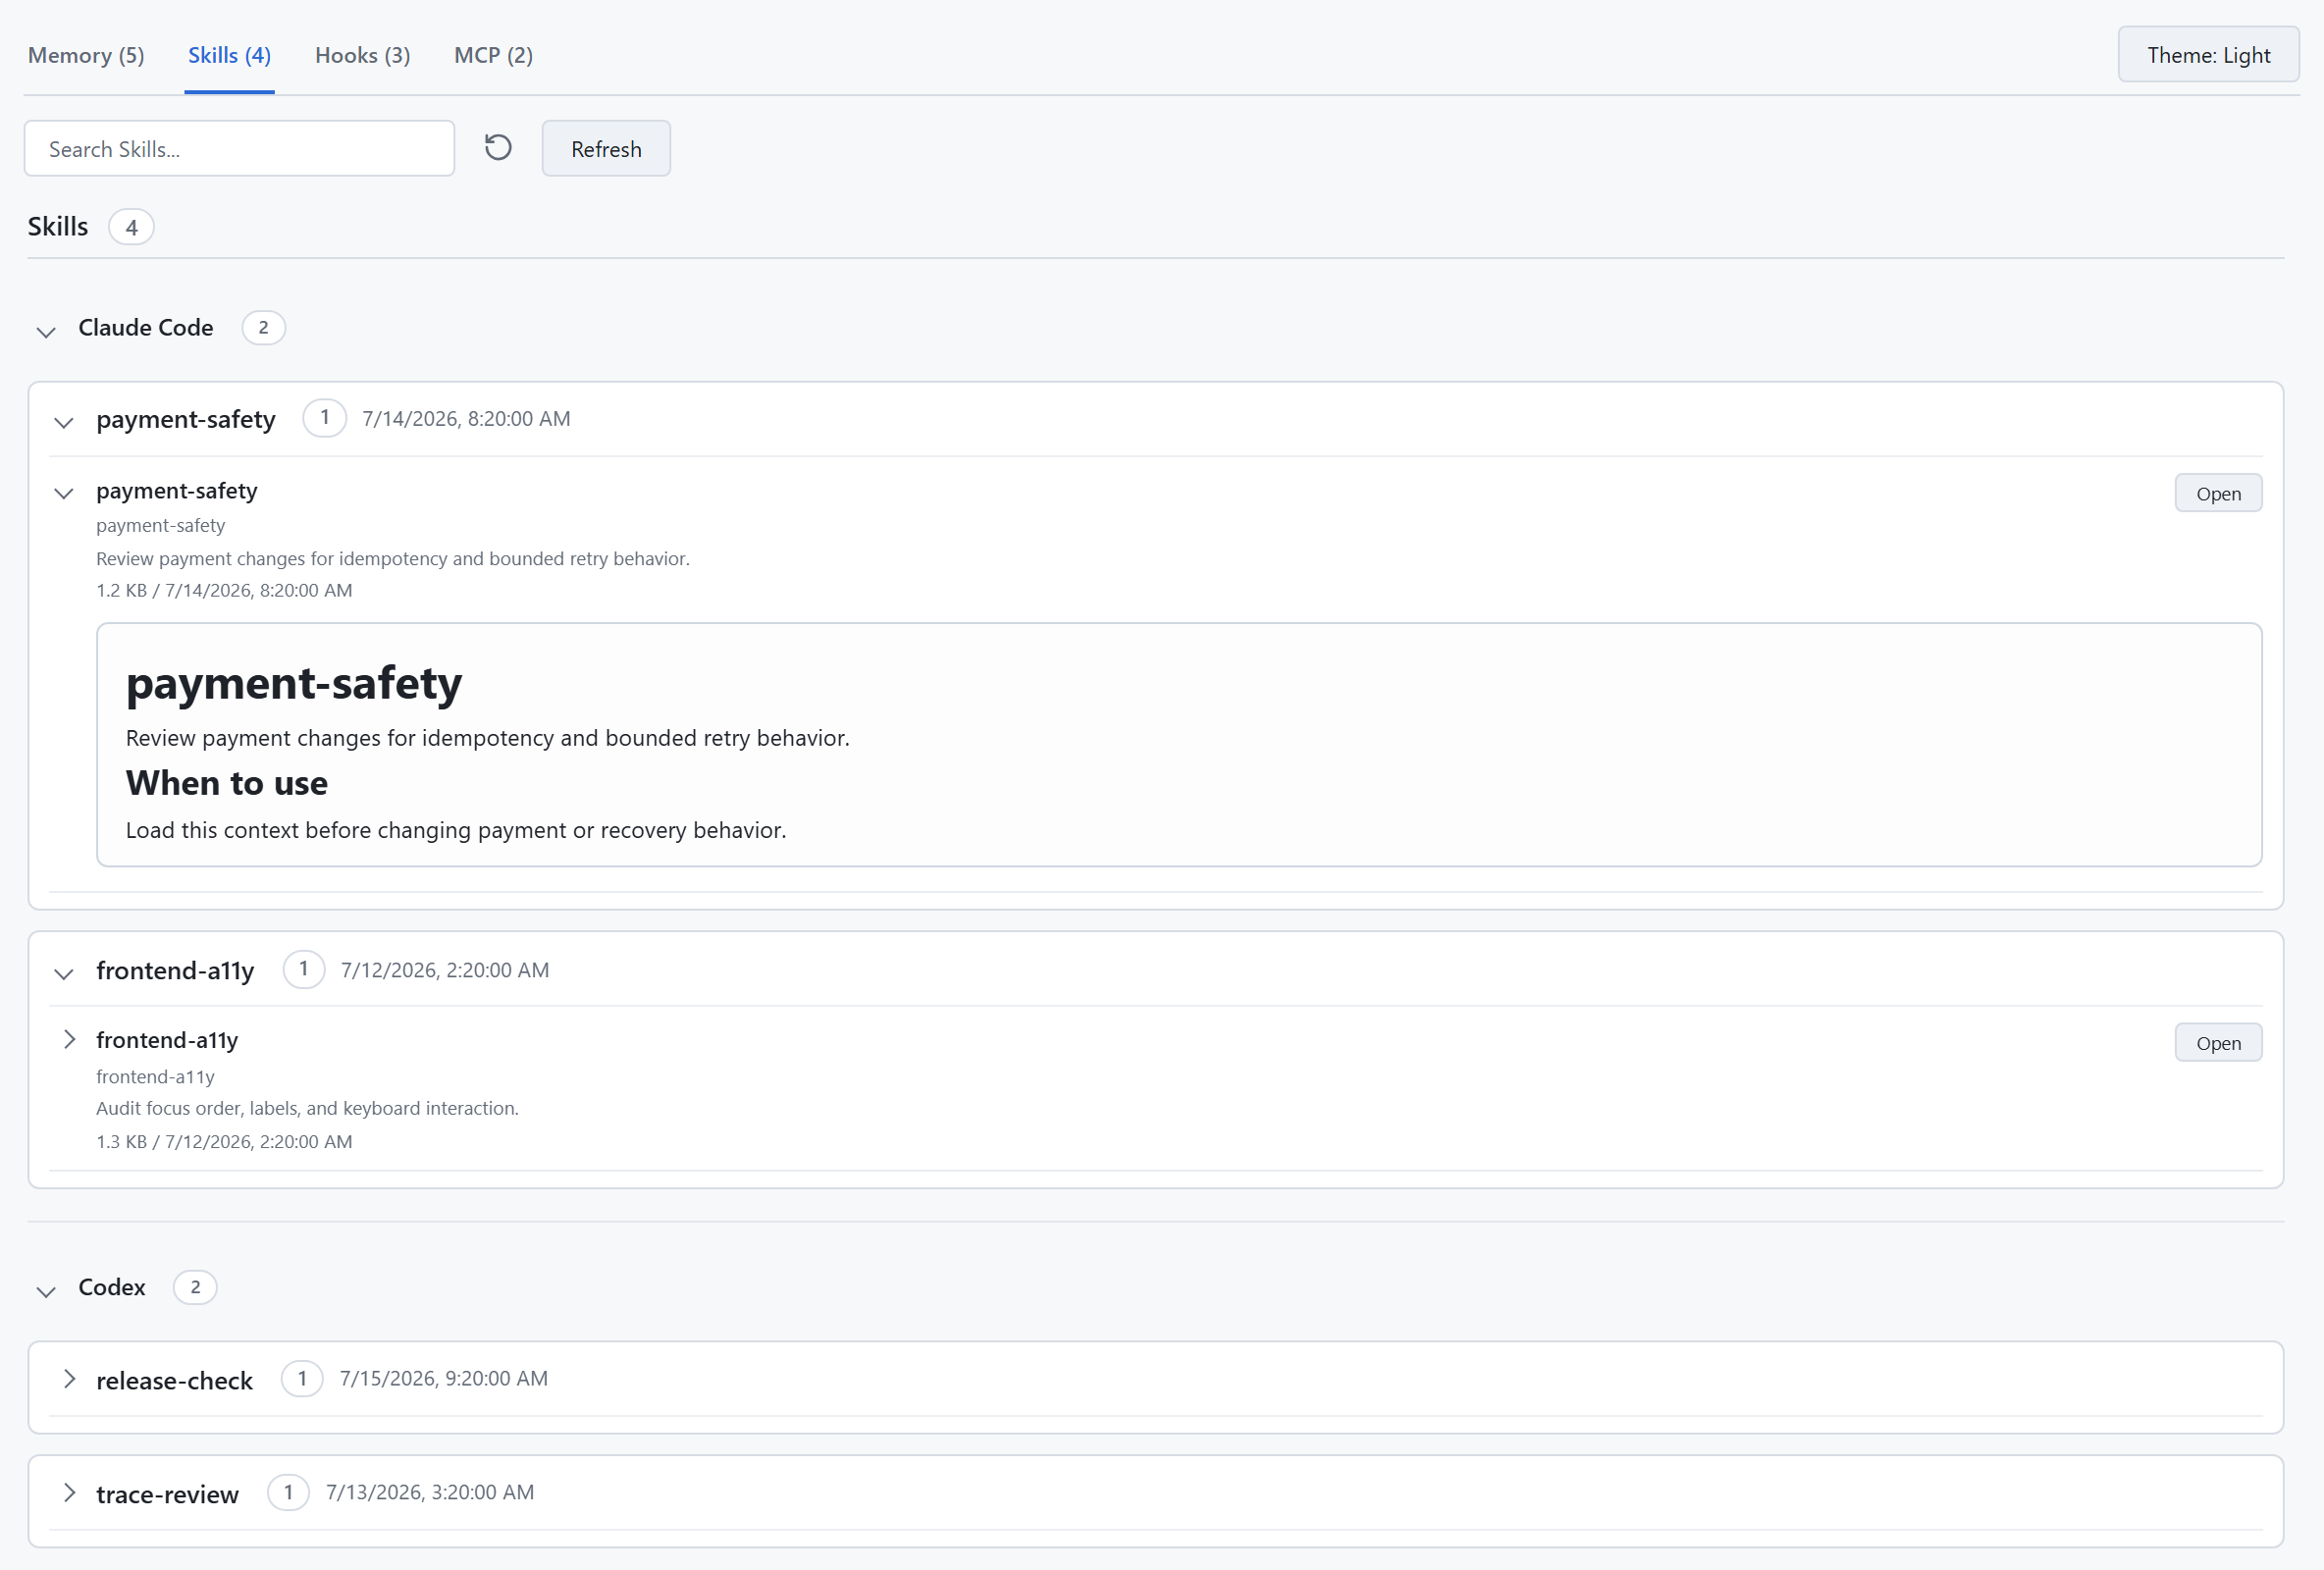
Inspect Session or global Memory, Skills, Hooks, MCP servers, Tool Schemas, and Sub-agents in one readable interface—then preview or edit the source.

  • Understand what shaped this specific run
  • Review global setup without opening folders of Markdown
  • Search, paginate, reset, preview, or open in the editor
Agent Setup skill preview

Session Harness explains this run. Agent Setup organizes reusable context across projects.

Feature library

The rest of the workflow, without the long manual.

01

Find & manage sessions

Recover work by the cue you actually remember.

⌕ Search

▾ July 2026 9

 ▾ Wed, Jul 15 3

Make checkout retries observable10:22 AM · Live
Refactor accessible palette3:42 PM · 184 KB

▾ D:/work/checkout-studio 7

Session file location
Time + pathGlobal searchTitlesLive refreshMulti-dayResumeExportSubagents
02

Timeline & process

Read the answer first; open the evidence when needed.

Prompt + finalAgent processWork groupsTool resultRaw inputFull-screen + copyDate/searchPaging
03

API evidence

Inspect full request assembly without one endless page.

Prompt assemblyParams + TTFTMessagesResponse eventsPer-block readerRaw JSONPrompt diffTool schemas
04

Views

Context, workload, tools, and phases in one window.

Play + scrubWindowContext curveWorkload BothPrompt jumpCompaction detailTool transitionsErrors + phases
05

Personal analytics

A useful local recap of how you work with agents.

Runtime RankAchievementsCalendarHabitsFrequent wordsClaude vs CodexTurn waitTTFT
06

Memory

Read this session’s context or review reusable memory across projects.

Session Memory

See the instructions and memory that shaped this run.

Agent Setup Memory

Search reusable Claude and Codex memory across projects.

Session MemoryProject instructionsAuto-memoryAgent SetupClaude + CodexSearchPreviewEdit source
07

Compare & replay

Contrast two trajectories or play one back as a conversation.

Shared playheadClaude vs CodexProcess differencesChat playbackSpeed controlPrompt + response

Local-first by design

Your sessions are analyzed where they already live.

Timeline, Views, Dashboard, Memory, and Harness read local session files. Optional Claude API capture uses a local proxy; it is off until you enable it.

Free VS Code extension

Make the next long agent run inspectable.

Install, open Trajectory Explorer, and select any existing Claude Code or Codex session.

Install from Marketplace ↗ext install yiyang-wu.trajectory-visualizer